Data Visualization with Microsoft Power BI
Data Visualization with Power BI is an event dedicated to the member in the university that interest with how to visualize the data using Power BI. Power BI is a collection of software services, apps, and connectors that work together to turn your unrelated sources of data into coherent, visually immersive, and interactive insights. This event was held aims to Enable the Data Culture in Organization with Power BI and Introduce the Template Apps in Power BI.
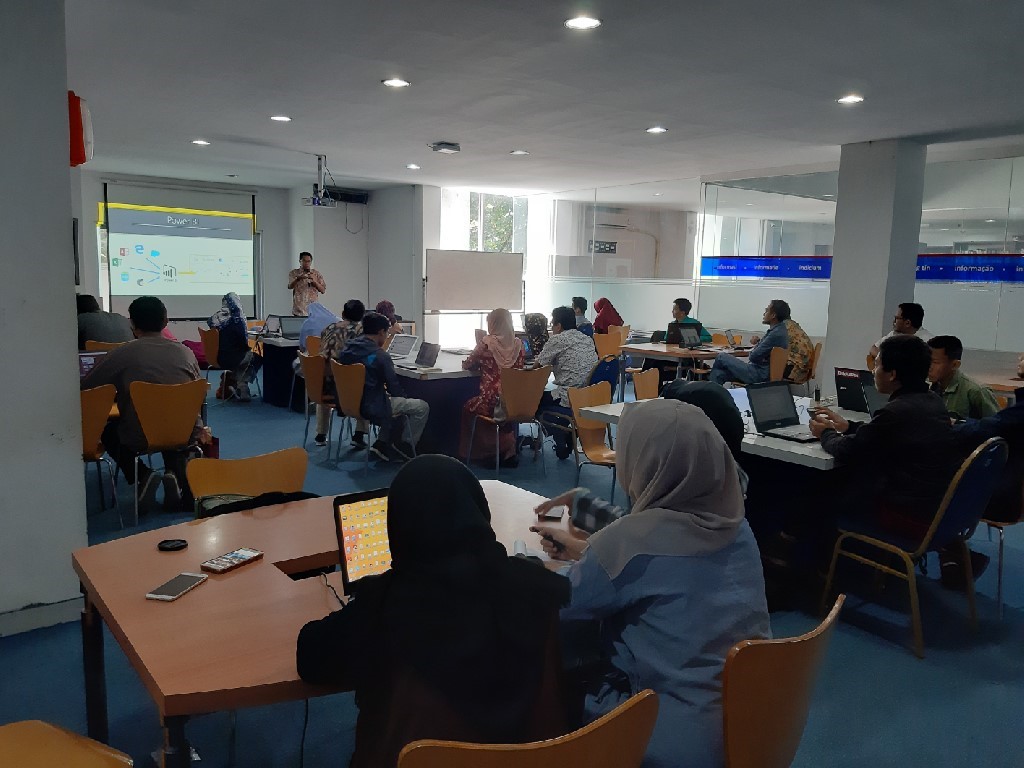
This event was held in the fourth quarter (Q4) on 21 June 2019 at Perpustakaan Fakultas Teknik UGM followed by 24 participants with a background as a non-government official. This event was divided into three sessions, sequentially includes Power BI Quick Review, Enabling Data Culture in Organization with Power BI, and Introducing Template Apps in Power BI. This material was delivered by Mr. Ridi Ferdiana as a part of Microsoft Innovation Team.
After this event, participants were got new insight about how to process the data, so they can get the value that can be used for their business or research. Participants were excited to this topic, it can be seen from the enthusiast to give ask the speaker about Power BI when the workshop is existing, how to get the data set, how to effectively processing data using Power BI, the difference of between Power BI Mobile, web, and desktop, etc.
Latest News
- Pelatihan Microsoft Word Tingkat Mahir
- Global Microsoft 365 Developer Bootcamp 2020
- Critical Thinking with Visual Studio
- Cloud Computing for Higher Ed Workshop
- Product Talks 101: Handling Product with Scrum
- Road to Be A Data and AI Ninja Session - Learning How to Code in Python
- Training of Trainer - PowerPoint as Digital Teaching Materials in The Virtual Classroom of Microsoft Teams
- Data processing and management using Excel and SharePoint Online
- Monitoring the Progress of Teacher Training in Indonesia Using Microsoft Teams
- Training of Trainer – Learning Management System using Moodle and Microsoft Teams